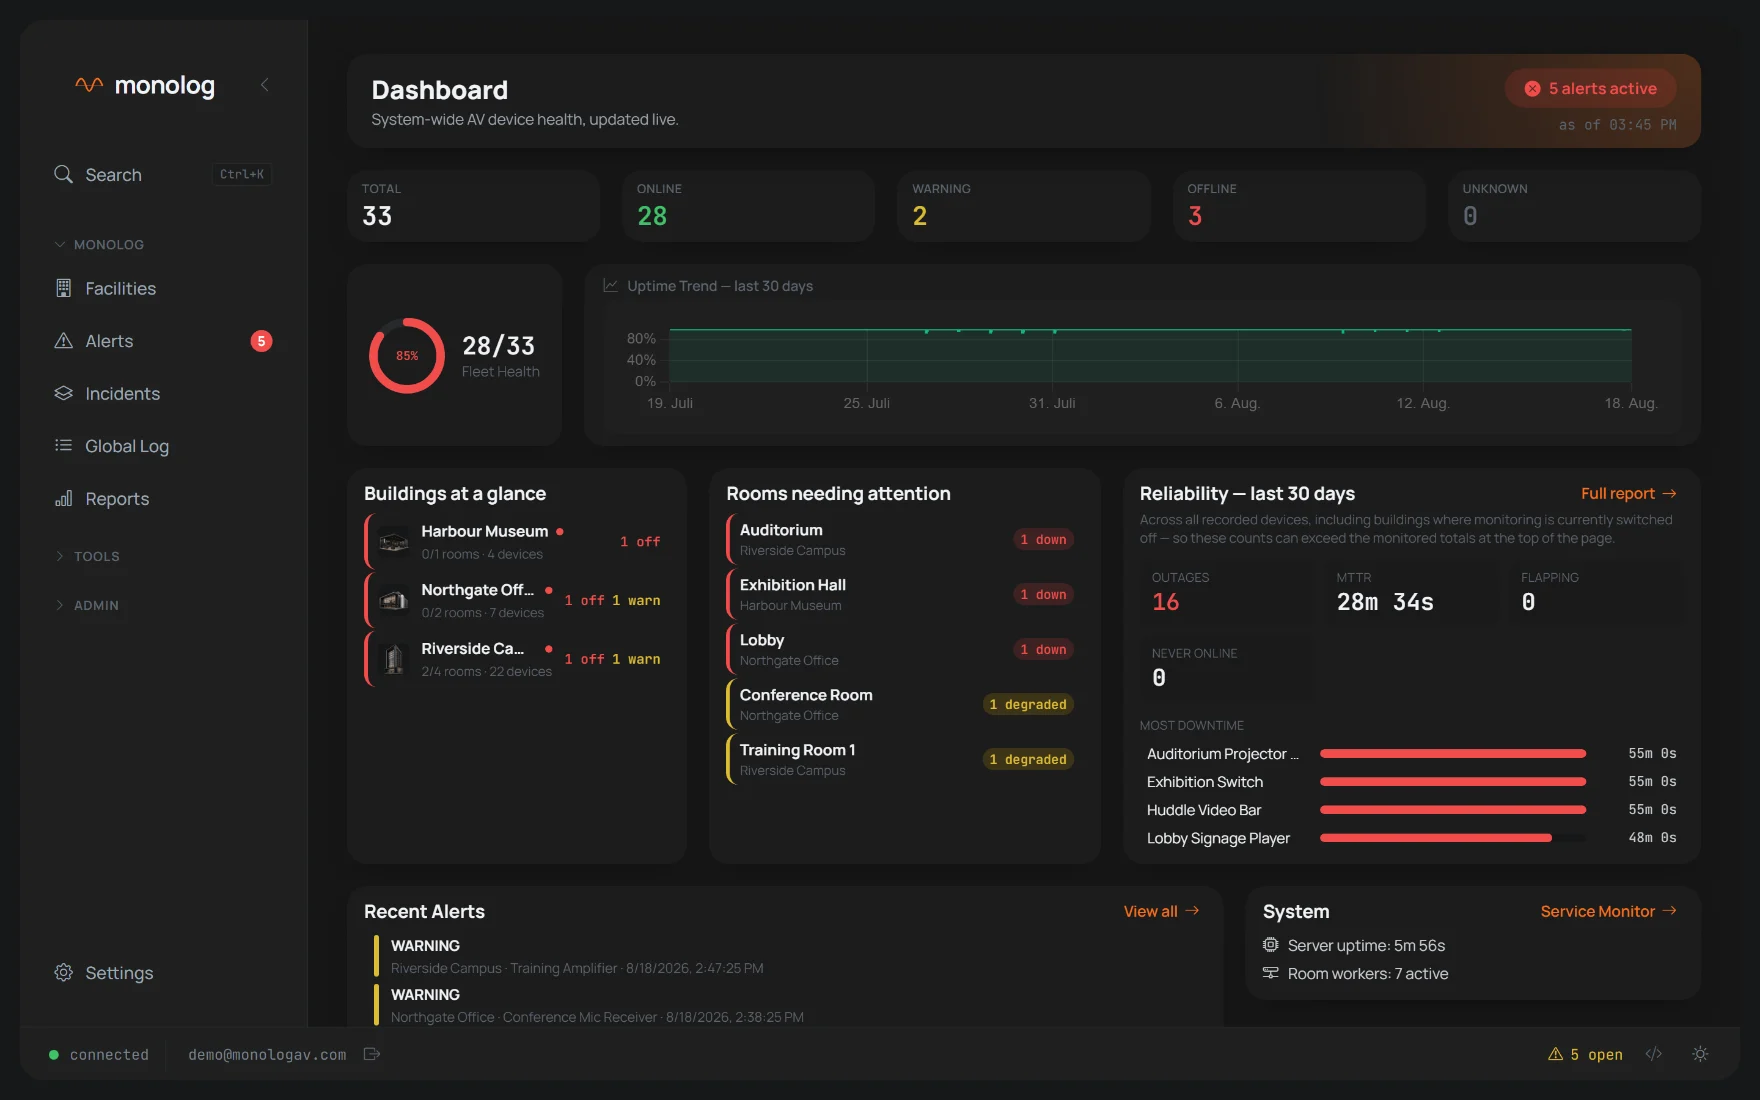
Your whole installation is already in a spreadsheet — devices, rooms, IP addresses, switch ports? Then monolog reads it and turns it into a running system: live device telemetry, ping, the events your Crestron, Q-SYS or AMX programming sends, control and room automation — all in one building and room context.
Runs on your own serverNo internet connection required Desktop app, opened in any browser
The problem
It started with a spreadsheet.
How much of that file is alive? None of it. Every device, every room, every address — right on the day it was written, silent every day after. It will never tell you that the auditorium projector stopped answering twenty minutes ago.
Documentation describes the past
A device list records what was installed — not what is running, and not what changed since.
Plain monitoring has no AV context
A failed ping says an address is unreachable. Not which room lost its display, which input it was on, or what else went down with it.
monolog runs the room
Your inventory becomes the structure, and everything that happens flows into it: status, telemetry, control, history.
How it works
Three steps, no rebuild of your documentation.
1
Import
Point monolog at the list you already maintain. Buildings, floors, rooms, devices, addresses, VLANs and switch ports come across in one pass.
2
Watch
Drivers query the devices directly for real telemetry — lamp hours, temperatures, inputs, signal presence — and every documented address is pinged. A Crestron, AMX or Q-SYS program can log its own room events into the same timeline.
3
Act
Alerts reach the right people, related ones are grouped into a single incident, and notes stay with the device.
What you get
Monitoring is one part of it.
One live picture per device
Real telemetry from the device driver, ICMP ping and the messages your control system sends — collapsed into one status: online, warning, offline, unknown. Every card says which channel answered.
AV context, not just IP addresses
Buildings, floors, rooms, devices, their interfaces and how they are wired together. A fault is reported where it happens — in a room, on a port, in a signal path.
Alerts & incidents
One alert per device — and one shared incident, with a root-cause candidate, when several fail together. Email, Teams or webhook.
One timeline for everything
Device events, ping results, control commands and what your Crestron or Q-SYS program logs — in one filterable history with a long-term archive, each line marked with where it came from.
Reports that print
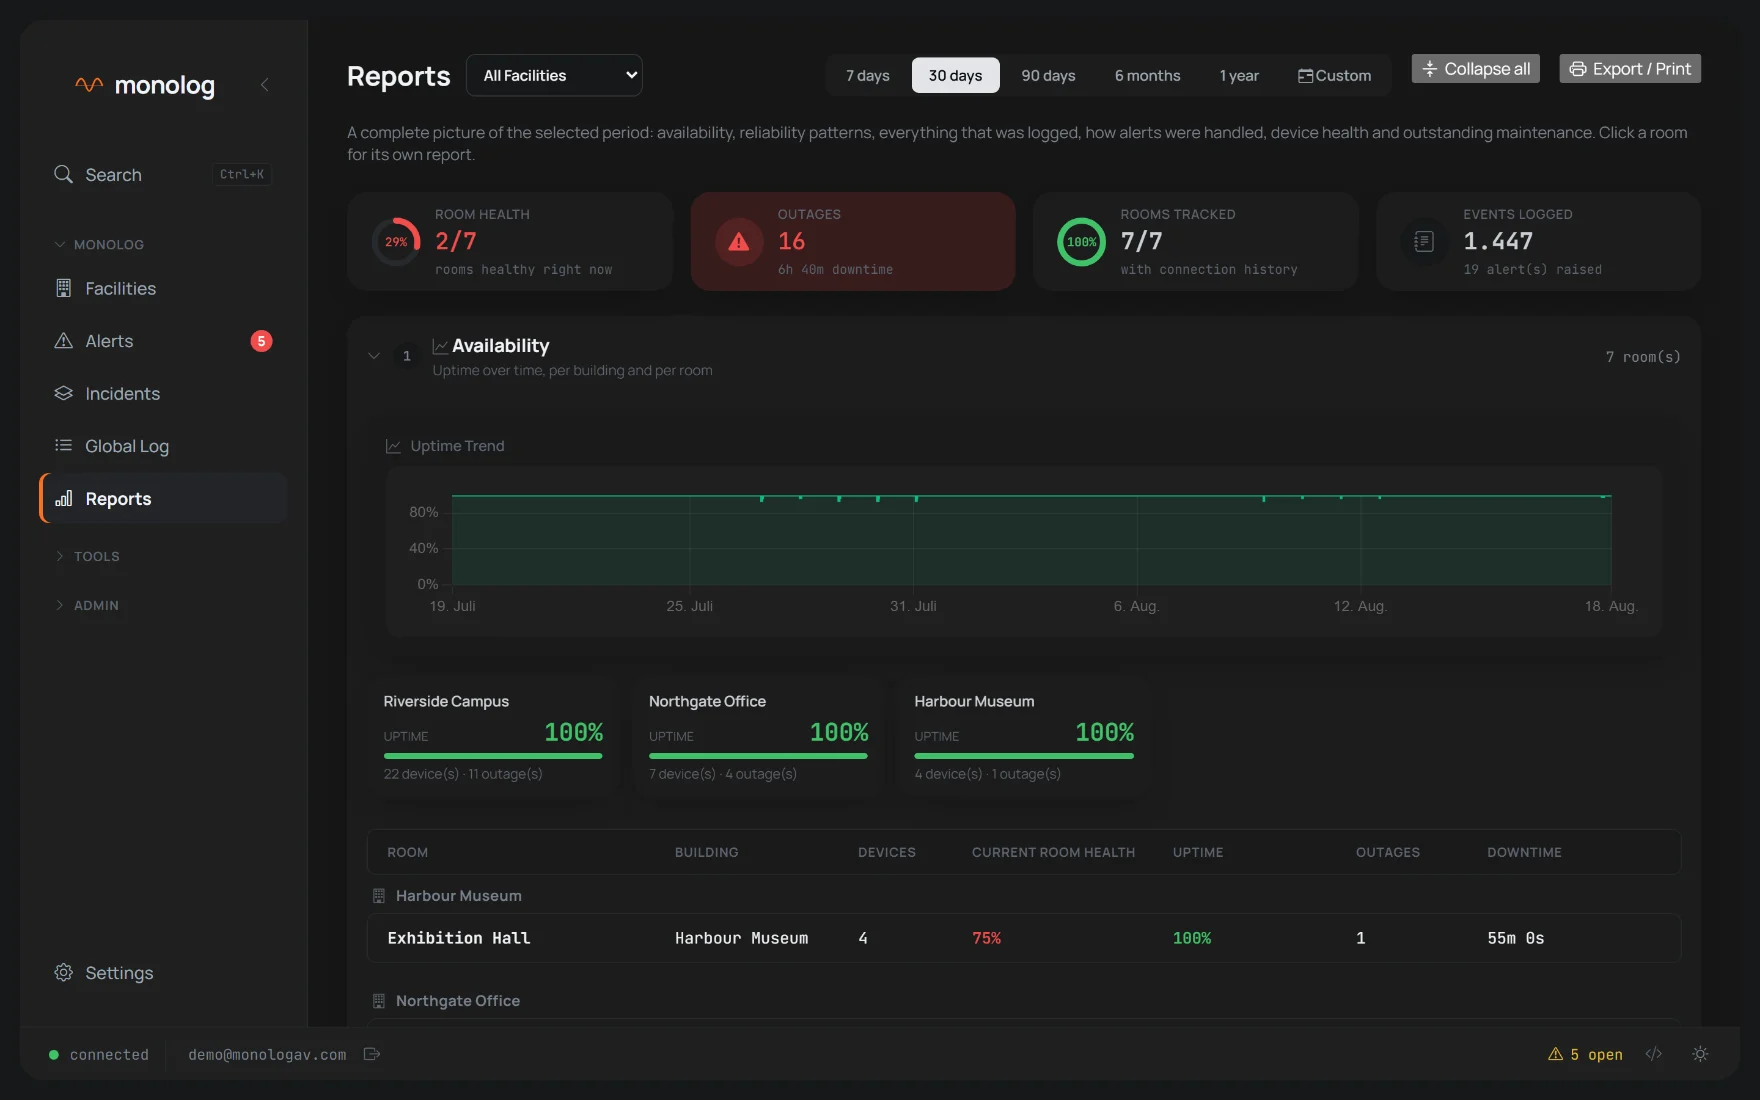
Availability, mean time to recovery, a reliability heatmap, flapping devices — as one print-ready document.
Control & room automation
Power, input, volume and routing straight from the browser — and Room ON/OFF as one ordered sequence across every device in the room, with a per-step result.
Network tools
A LAN scanner for what is really on the network, a ping manager for the rest, and switch, port and VLAN per interface.
Roles & security
Four roles, device credentials encrypted at rest, HTTPS out of the box, and a licence tied to the installation.
Riverside Campus · Auditorium
Selected device
ProjectorOnline
InputHDMI 2
Lamp hours1,842 h
Temperature48 °C
10.20.1.52Barco G62-W11
Display wallOnline
InputHDMI 1
Resolution3840 × 2160
PowerOn
10.20.1.34Sony FW-75BZ40L
Audio DSPOnline
DesignAuditorium v7
Programme busUnmuted
Level−12 dB
10.20.1.51Q-SYS Core 8 Flex
Ceiling micWarning
Firmwareupdate available
EncryptionOn
Coverage8 lobes
10.20.1.41Shure MXA920
Every device in the room, its live status, and what its driver last reported. Click any card and the detail is the same one your technician sees.
Screens
The whole installation, one browser tab.
Which devices need software installed? Only the server itself. monolog is installed once in the building and is reachable from any browser on the network afterwards — desktop, notebook, tablet, wall panel. The screens below show a demonstration installation.
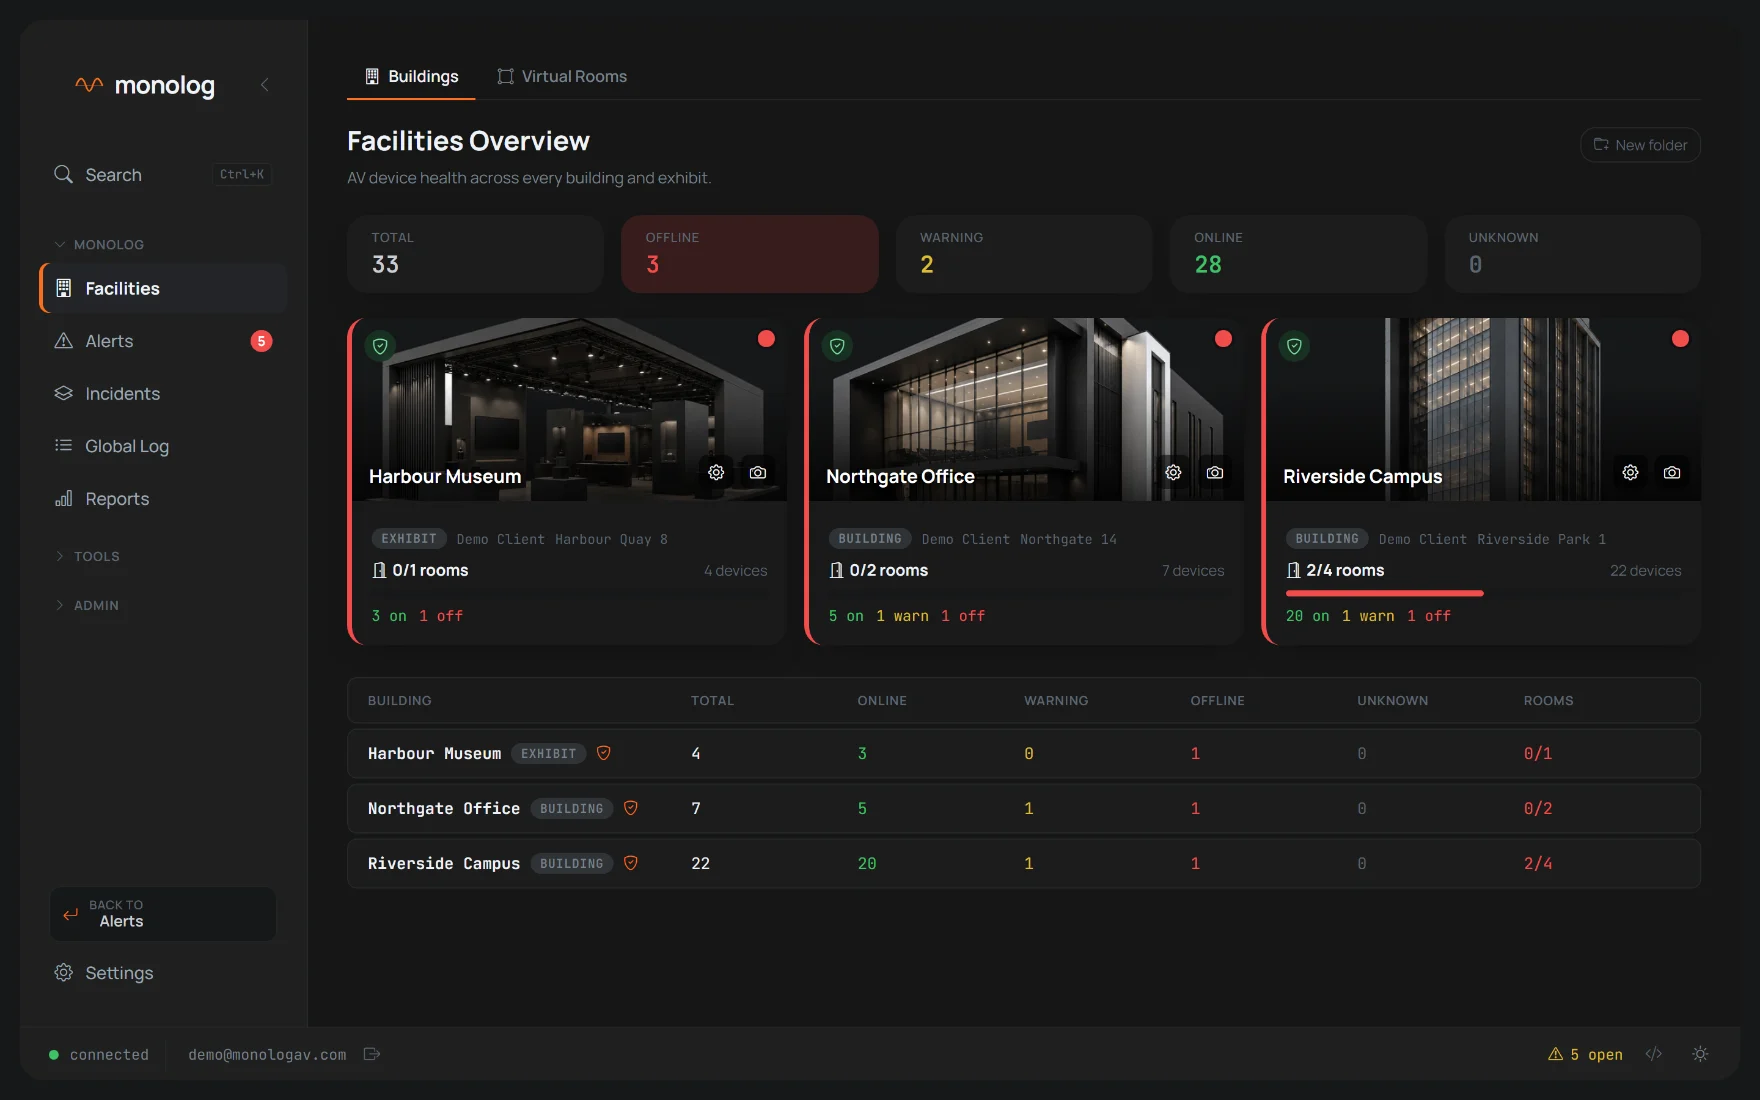
Facilities. Every building and exhibit at a glance — healthy rooms,
device counts and a red marker the moment something in there stops answering.
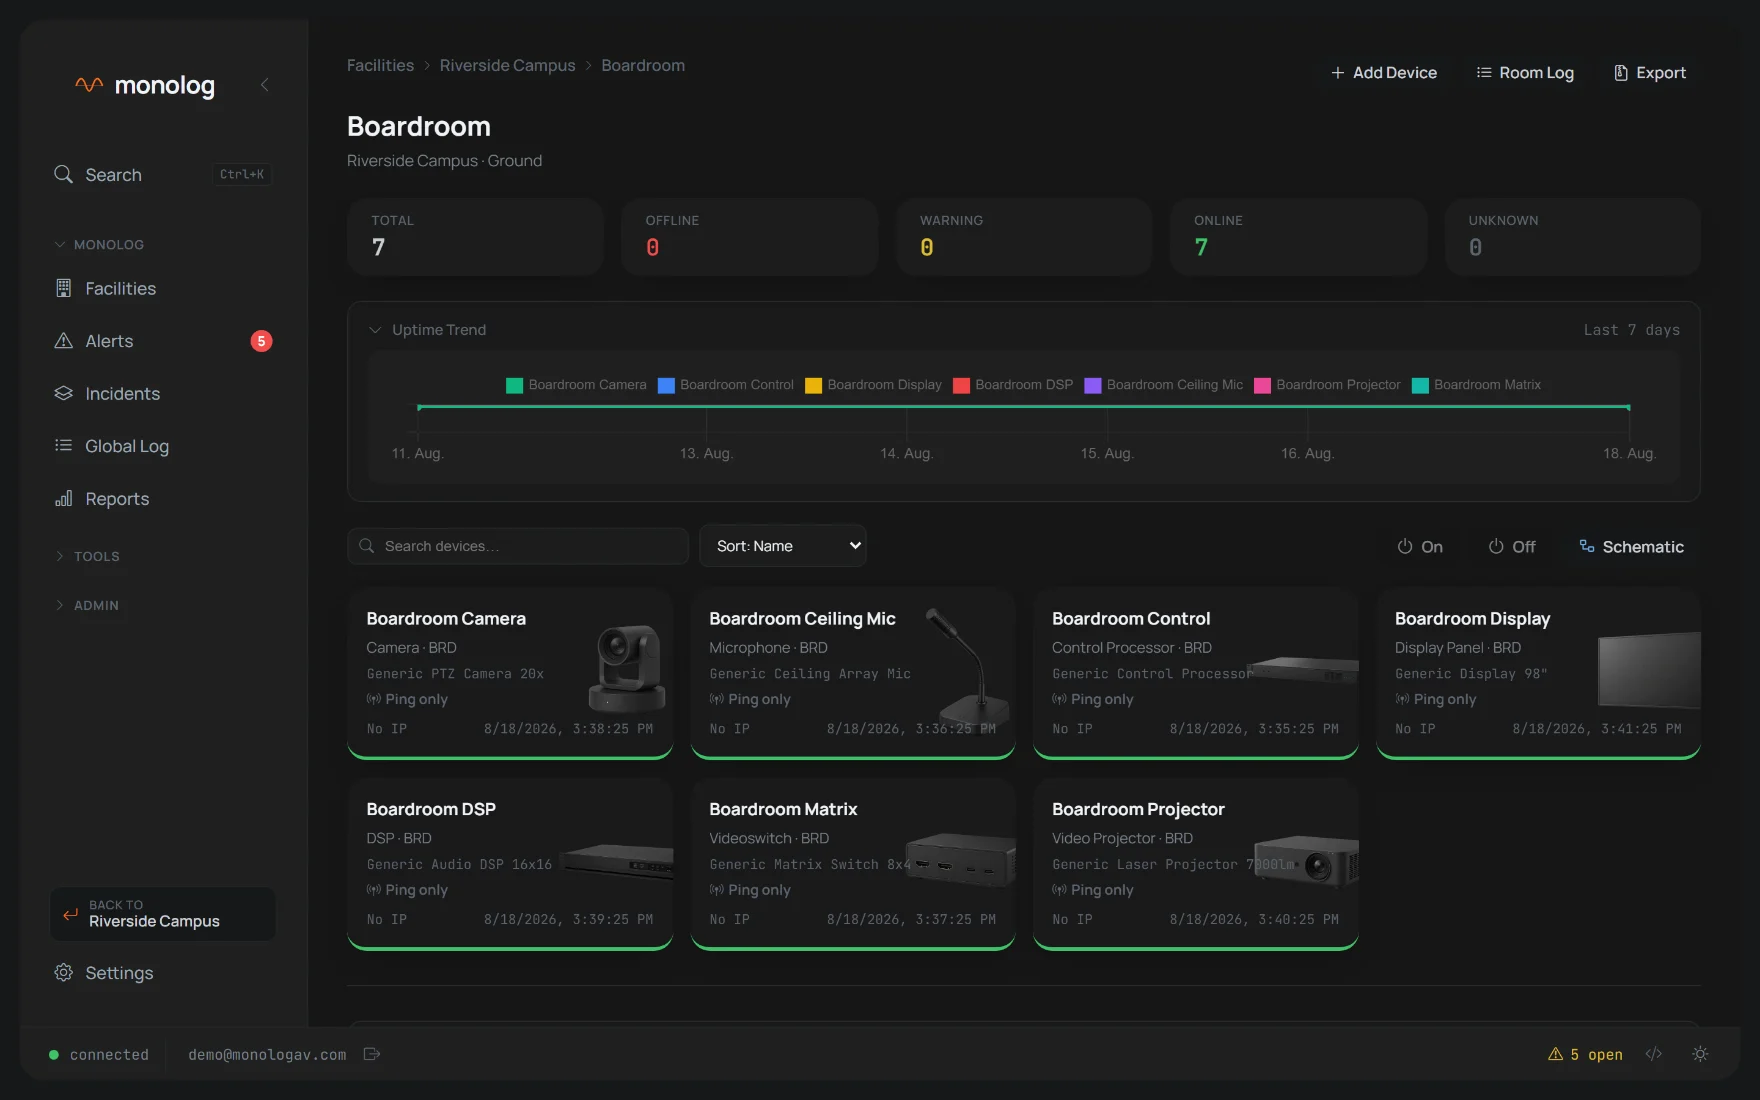
Room detail. Every device in the room, its live status and Room ON/OFF.
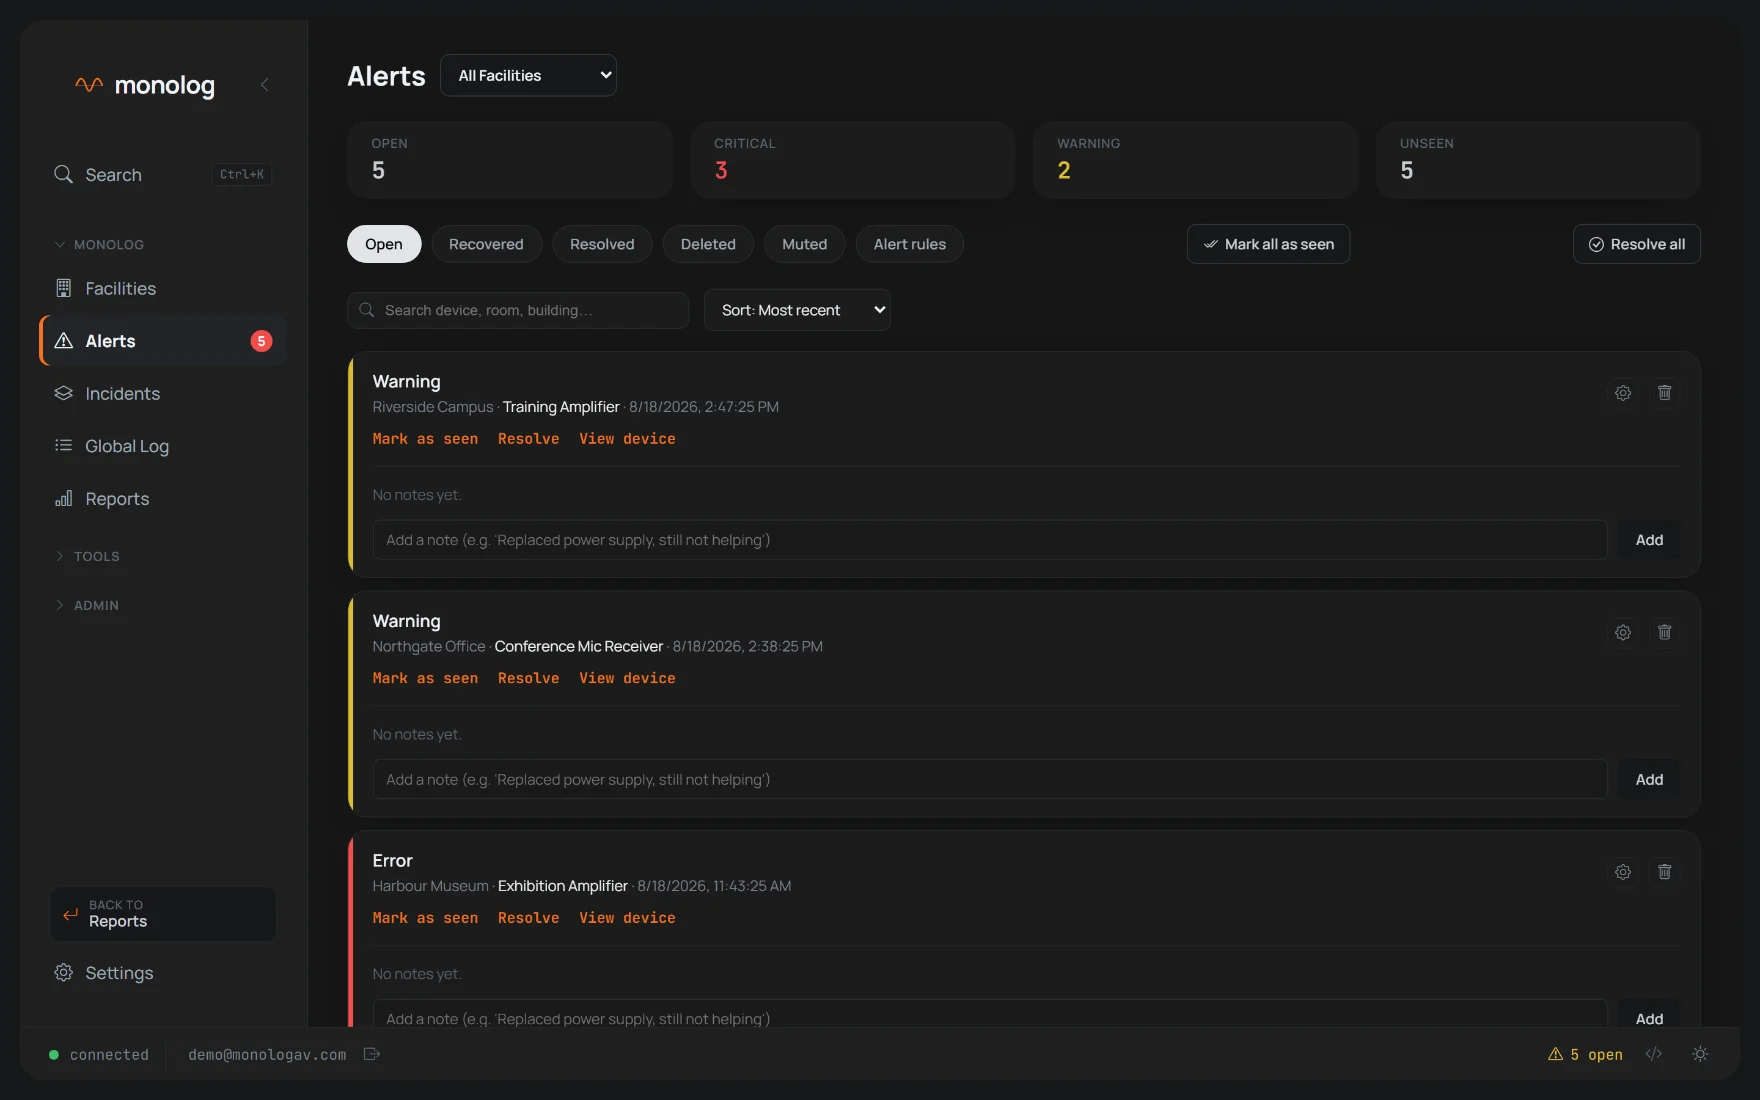
Alerts. Acknowledge, resolve, and keep the notes with the device.
Reports. Availability and reliability over any period, ready to print.
Deployment
Runs where your systems run.
monolog needs no internet connection at all.
Is your AV network isolated, with no route to the internet? Good — that is where monolog belongs. It is installed in the building it watches; monitoring, alerts, history, reports and control all work with no way out. Only an email or Teams notification needs one.
monomanager, the engineering and service tool for integrators, is in preparation.
On premise A Windows desktop application with a tray icon — it starts with Windows and keeps running in the background.
Browser based Everyone else just opens a browser on the network — no client software to roll out.
Offline capable Runs on an isolated network — no internet, no external database, no cloud.
Your data stays put Everything remains on the machine you installed it on.
Licensed per install One licence per installation, with a German user manual.
Demo
See it on your own device list.
Want to see it on your own device list? One short message and we arrange a walkthrough — on a real list, not a demonstration one.
A guided walkthrough of the running system, roughly 30 minutes.
An honest answer on which of your devices can be read and controlled today.
No account, no obligation, no automated follow-up mails.